


Checking a few critical performance indicators before replacing a RO membrane or filter cartridge prevents unnecessary cost, downtime, and misdiagnosis for RO systems across residential, commercial, and industrial applications in the United States. RO components operate against measurable performance criteria such as TDS rejection, permeate flow, pressure profile, and defined service life, not just calendar time. Premature replacements in high-usage facilities can waste hundreds of dollars per membrane or filter set when issues originate in pre-treatment or operating conditions instead. This article presents a practical, data-driven pre-replacement checklist so maintenance teams and operators can decide whether to replace, clean, or continue running RO membranes and filter cartridges with confidence, while protecting budgets and system reliability.
What should you check before replacing a RO membrane?
Before replacing a RO membrane, check TDS rejection, permeate flow, pressure drop across the system, and feed water conditions against the system’s original baseline specifications. These measurements show whether the membrane itself has degraded or whether performance loss originates in pre-treatment, hydraulics, or operating conditions instead.
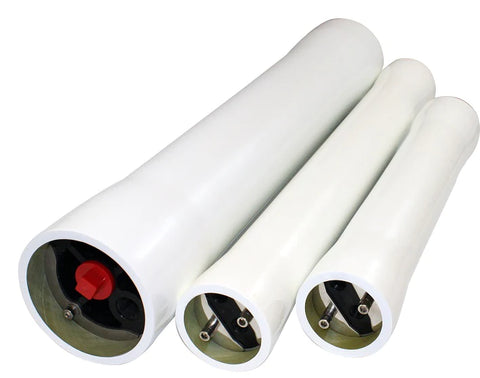
Many membranes distributed by AXEON Supply operate within clearly defined limits, such as applied pressures near 80–150 psi, nominal salt rejection around 96–99%, maximum operating temperature near 113 °F, maximum silt density index of 5, and zero free chlorine tolerance on polyamide thin‑film composite elements. These specifications create realistic benchmarks for evaluating current readings against expected behavior under comparable feed water quality and temperature.
The following sections examine each diagnostic point in order—TDS rejection, permeate flow, pressure profile, and feed water quality—so technicians and operators can follow a consistent, repeatable procedure before deciding whether to replace, clean, or continue operating a RO membrane.
How do you use TDS rejection to decide on membrane replacement?
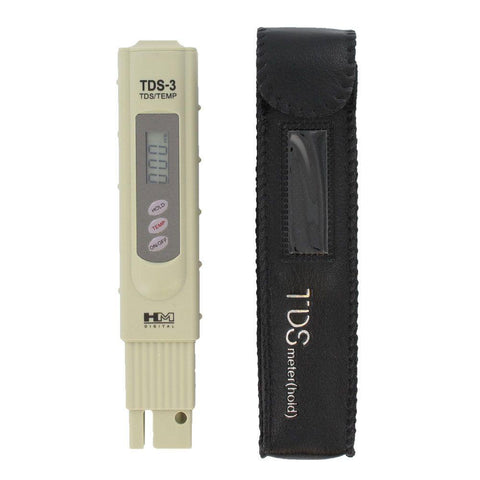
Use TDS rejection percentage to decide on membrane replacement by comparing current permeate TDS against feed TDS and replacing when rejection falls significantly below the membrane’s nominal performance. TDS rejection expresses how much dissolved solids the membrane removes, calculated by relating the difference between feed and permeate TDS to the feed TDS without needing complex math notation.
Many residential and commercial RO membranes are designed to deliver roughly 96–99% nominal salt rejection under their specified operating conditions. When a membrane specified at 99% rejection stabilizes closer to about 90–92% rejection over multiple readings under similar feed quality and temperature, this pattern usually indicates advanced fouling or aging rather than normal short-term variation. Technicians should always compare current readings with baseline commissioning data recorded when the system was new and factor in any changes in feed TDS, temperature, or upstream treatment. Analytics-driven facility managers benefit from logging these measurements over time so replacement decisions follow numeric thresholds instead of subjective impressions.
How does permeate flow rate indicate membrane condition?
Permeate flow rate indicates membrane condition because a significant drop from the design gallons per day (GPD) at normal pressure suggests fouling, scaling, or compaction. Many residential thin‑film composite elements are designed in the range of roughly 50–500 GPD, while commercial elements such as extra‑low and low‑energy models are often rated up to about 2,500 GPD at their specified applied pressures and within defined operating limits.
A steady decline in permeate flow at essentially the same feed pressure, temperature, and feed TDS usually points to progressive fouling or scaling on the membrane surface, whereas a sudden, sharp loss of flow can also indicate upstream blockage, valve misadjustment, or pump issues. When measured permeate production falls roughly 30–50% below the expected design rate despite normal pressure, temperature, and pre‑treatment performance, the membrane should be assessed for chemical cleaning or scheduled replacement. Technicians should always cross‑check flow changes with pressure readings and pre‑filter condition before concluding that the membrane itself has failed.
Why should you check pressure drop across the RO system?
Check pressure drop across the RO system because an increasing differential between feed and concentrate pressure indicates fouling or blockage in the membrane or in the pre‑filtration stages. Extra‑low pressure elements often operate near 80–100 psi, while many tap water RO membranes run closer to about 150 psi, so monitoring both inlet and concentrate line gauges against these normal ranges is essential for meaningful interpretation.
A rising pressure drop at essentially the same feed flow can signal particulate fouling, scaling, or biofouling inside the membrane element or housing, but the same symptom can also originate from clogged sediment or carbon filters upstream. Establishing a baseline pressure profile during commissioning and flagging when differential pressure increases by roughly 15–20 psi or more across the train helps maintenance teams decide when to investigate and intervene. Pressure data alone does not prove membrane failure; it must always be evaluated together with TDS rejection and permeate flow trends to avoid premature replacement.
What should you check before replacing a filter cartridge?
Before replacing a filter cartridge, check service life, pressure drop, visible fouling, and downstream water quality relative to the cartridge’s specifications. Inline carbon cartridges are often rated for about 2,500 gallons of throughput or roughly six months of service at their specified flow rate and inlet water quality, while many sediment depth filters are available in 1–20 micron ratings with graded density to increase dirt-holding capacity and minimize initial pressure drop.
In heavy-duty commercial or industrial applications, cartridges can reach their particulate or chlorine capacity much sooner than calendar rules suggest, particularly at higher flow, higher sediment loading, or elevated disinfectant levels. Relying only on “every six months” guidance risks either premature replacement or running cartridges past their effective life. The following sections explain how to read pressure changes, flow behavior, and visible media condition alongside the rated capacity so that replacement decisions reflect actual operating conditions instead of generic time intervals.
How do pressure and flow changes signal cartridge replacement?
Pressure drop across a cartridge combined with reduced flow at the same pump setting signals it is nearing the end of its dirt- or adsorption capacity. Sediment depth cartridges are engineered with graded density and outside‑in flow paths to keep initial pressure loss low, so a noticeable rise in differential pressure as flow declines is a strong indicator that the media is loaded with particulate.
When a system shows slower tank fill times, weaker faucet flow, or higher inlet pressure with lower downstream pressure, maintenance teams should compare current readings with the original clean‑cartridge baseline recorded at installation. Documenting typical “clean” versus “loaded” pressure differentials for each installation turns future replacement decisions into an objective process instead of relying on subjective impressions about flow quality alone. This approach aligns cartridge changes with actual hydraulic performance and capacity use, not just elapsed time.
How do you factor service life, media capacity, and application into cartridge checks?
Factor service life, media capacity, and application into cartridge checks by comparing actual throughput and contaminant loading against the cartridge’s rated gallons, micron rating, and media type. Activated carbon cartridges with a specified chlorine capacity measured in thousands of gallons will exhaust more quickly on heavily chlorinated municipal water than on low-chlorine sources, even if both installations are the same age.
Mixed bed deionization cartridges with defined grain capacity for calcium carbonate removal will also require more frequent replacement in high TDS polishing applications than in light‑duty use at the same flow rate. In high‑flow or high‑sediment environments such as car washes, food service, or manufacturing, cartridges often reach capacity limits long before generic time estimates, so tracking gallons processed with a meter or logging runtime hours helps align changes with real loading. Application‑specific tracking creates a data‑backed replacement schedule instead of relying on “every six months” rules.
How do you distinguish between membrane and pre-filter problems?
Distinguish between membrane and pre‑filter problems by comparing patterns in TDS, flow, and pressure data along with visual inspection of cartridges and housings. A structured reading of these three parameters together shows whether performance loss originates in the RO membrane itself or in upstream sediment and carbon stages.
Using this table as a quick decision aid helps technicians avoid unnecessary membrane replacements, focus first on lower‑cost pre‑filters, and resolve flow or quality complaints faster with objective field checks.
Typical symptoms of membrane vs. filter cartridge issues
| Symptom pattern | More likely cause | What to check first |
|---|---|---|
| Rising permeate TDS, normal flow, stable dp | Aging or fouled membrane | Compare rejection against baseline and the membrane data sheet |
| Normal TDS, reduced flow, higher dp | Loaded sediment/carbon filter | Inspect and replace cartridges, then recheck pressures |
| Low flow, high dp, rising TDS | Severe membrane fouling | Assess the feasibility of cleaning versus membrane replacement |
| Normal dp, sudden no flow | Valves, pump, or plumbing | Verify valve positions, pump operation, and feed availability |
Using this table as a quick decision aid helps technicians avoid unnecessary membrane replacements, focus first on lower‑cost pre‑filters, and resolve flow or quality complaints faster with objective field checks.
How can a simple maintenance checklist extend membrane and cartridge life?
A structured maintenance checklist extends membrane and cartridge life by catching early performance changes and protecting components from avoidable hydraulic and chemical stress. Facilities that log key operating data instead of relying on memory or time-based rules identify issues sooner and plan replacements with fewer surprises.
Practical checklist actions include:
- Log feed, permeate, and concentrate pressures at regular intervals and compare them with the commissioning baseline.
- Record feed and permeate TDS at a consistent temperature to track rejection drift over time rather than reacting to a single reading.
- Inspect and replace sediment and carbon pre‑filters according to both pressure drop and rated capacity, not just elapsed months.
- Verify that upstream treatment maintains effective chlorine reduction before TFC RO membranes to protect the polyamide layer.
- Confirm operation within the installed membrane series’ specified temperature, pressure, and SDI limits documented on the data sheet.
Closing: When is replacement the right decision?
Replacement is the right decision when TDS rejection, permeate flow, and pressure data together show sustained performance loss that cannot be restored by chemical cleaning, pre‑filter changes, or operating condition corrections. Data‑based replacement decisions protect maintenance budgets, reduce unexpected downtime, and support consistent water quality for residential, commercial, and industrial users. AXEON Supply can then act as a technical resource to help teams specify compatible membranes and filter cartridges once systematic checks confirm that replacement is truly necessary.